TOTAL SHAREHOLDER RETURN
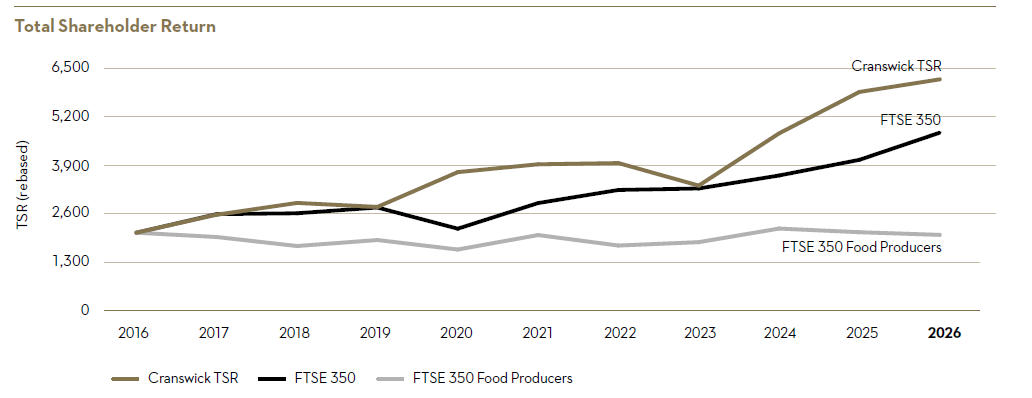
The graph below shows the percentage change (from a base of 100 in March 2016) in the TSR (with dividends reinvested) for each of the last ten years on a holding of the Company’s shares against the corresponding change in a hypothetical holding in the shares of the FTSE 350 Food Producers and Processors Price Index (‘FTSE FPP’) and the FTSE 350 Index (‘FTSE 350’). The FTSE FPP and the FTSE 350 were chosen as representative benchmarks of the sector and companies of a comparable size, along with details of the CEO’s remuneration in each of those years.