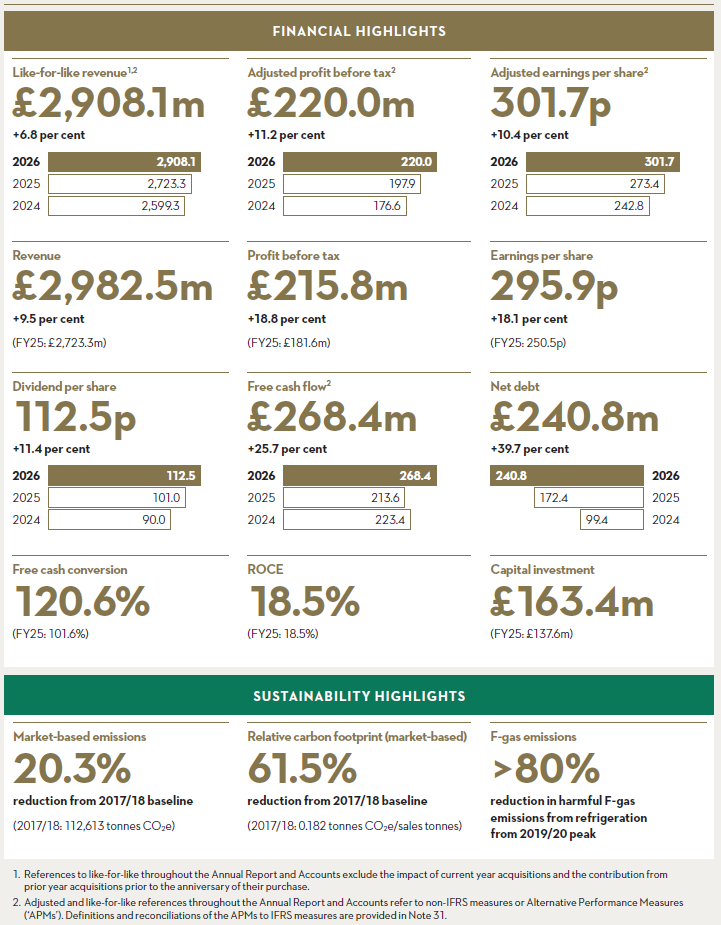
- Strong revenue growth of 9.5% with like-for-like revenue 6.8% ahead:
- UK food revenue grew 9.4% underpinned by strong volume growth of 8.3% and record Christmas trading
- Poultry revenue up 13.9% and now represents 20.3% of reported Group revenue
- Gourmet Products revenue increased 15.3% with a strong contribution from Blakemans
- Pet Products revenue 29.8% ahead reflecting expansion of the Pets at Home relationship
- Adjusted operating margin increased by 35bps to 7.9%, driven by the performance of our integrated poultry supply chain, investment in automation, operational leverage, excellent capacity utilisation and disciplined cost control
- Free cash conversion of 120.6%, reflecting record cash generated from operations of £322.3m
- ROCE remained strong at 18.5% on record investment
- Net debt (excluding IFRS 16) of £65.0m with Net debt (excluding IFRS 16)/Adjusted EBITDA just 0.2x
- Performance across all financial measures well ahead of medium-term targets